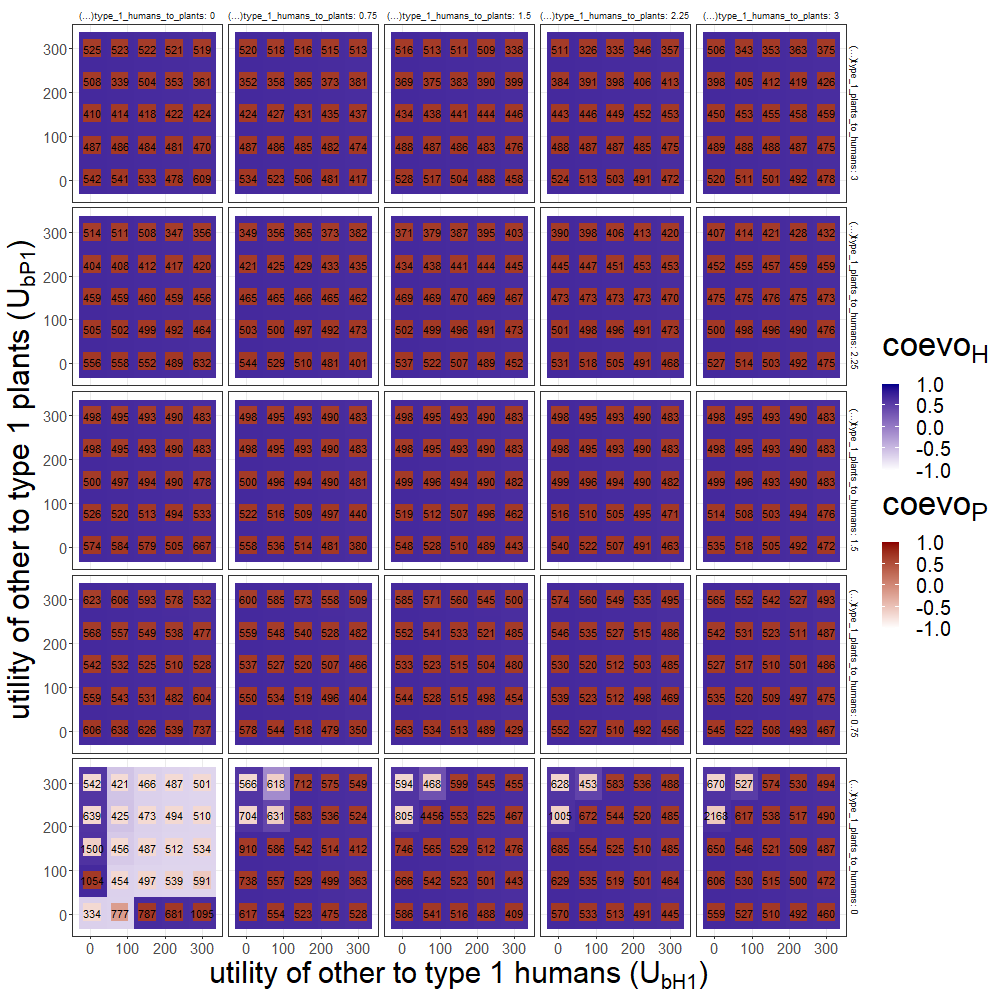
4.6 Utility from other resources and utility per capita of type 1 humans and plants (\(U_{bP_{1}}\) x \(U_{bH_{1}}\) x \(\bar{U}_{H_{1}P}\) x \(\bar{U}_{P_{1}H}\))
This exploration reflects the state at the start of simulations (both populations are mostly of type 1).
| parameter | value |
|---|---|
| initial_population_humans | 10 |
| initial_population_plants | 10 |
| number_types_humans | 30 |
| number_types_plants | 30 |
| undirected_variation_humans | 0.15 |
| undirected_variation_plants | 0.15 |
| intrinsic_growth_rate_humans | 0.04 |
| intrinsic_growth_rate_plants | 0.1 |
| utility_per_capita_type_n_plants_to_humans | 1.5 |
| utility_per_capita_type_n_humans_to_plants | 1 |
| utility_per_capita_type_1_plants_to_humans | 0 - 3 (sample = 5 ) |
| utility_per_capita_type_1_humans_to_plants | 0 - 3 (sample = 5 ) |
| utility_other_to_type_n_humans | 10 |
| utility_other_to_type_n_plants | 20 |
| utility_other_to_type_1_humans | 5 - 300 (sample = 5 ) |
| utility_other_to_type_1_plants | 5 - 300 (sample = 5 ) |
| max_area | 200 |
| max_iterations | 5000 |
| reltol_exponential | 6 |
| coevolution_threshold | 0.5 |
| humans | 6.65445468351648 - 373.829001349403 (sample = 580 ) |
| plants | 7.25341088271487 - 200 (sample = 22 ) |
| coevolution_coefficient_humans | -0.689067710065305 - 0.700801110595132 (sample = 580 ) |
| coevolution_coefficient_plants | -0.700948542920777 - 0.6969339607777 (sample = 625 ) |
| dependency_coefficient_humans | -0.82470273295647 - 0.944381662989186 (sample = 580 ) |
| dependency_coefficient_plants | -0.889305217158245 - 0.919567244926042 (sample = 625 ) |
| timing_humans | 0 - 674 (sample = 127 ) |
| timing_plants | 0 - 4012 (sample = 149 ) |
| time_end | 326 - 4456 (sample = 235 ) |
| adaptativeCost.H | 0 |
| adaptativeCost.P | 0 |