1.1 Fast coevolution (default)
| parameter | values |
|---|---|
| initial_population_humans | 10 |
| initial_population_plants | 10 |
| number_types_humans | 30 |
| number_types_plants | 30 |
| undirected_variation_humans | 0.15 |
| undirected_variation_plants | 0.15 |
| intrinsic_growth_rate_humans | 0.04 |
| intrinsic_growth_rate_plants | 0.1 |
| utility_per_capita_type_n_plants_to_humans | 1.5 |
| utility_per_capita_type_n_humans_to_plants | 1 |
| utility_per_capita_type_1_plants_to_humans | 0.15 |
| utility_per_capita_type_1_humans_to_plants | 0 |
| utility_other_to_type_n_humans | 10 |
| utility_other_to_type_n_plants | 20 |
| utility_other_to_type_1_humans | 80 |
| utility_other_to_type_1_plants | 100 |
| max_area | 200 |
| max_iterations | 5000 |
| reltol_exponential | 6 |
| coevolution_threshold | 0.5 |
| Abbreviation | Value |
|---|---|
time_end |
699 |
coevolution_coefficient_humans |
0.6913054 |
coevolution_coefficient_plants |
0.6763894 |
dependency_coefficient_humans |
0.8855591 |
dependency_coefficient_plants |
0.8058295 |
timing_humans |
236 |
timing_plants |
252 |
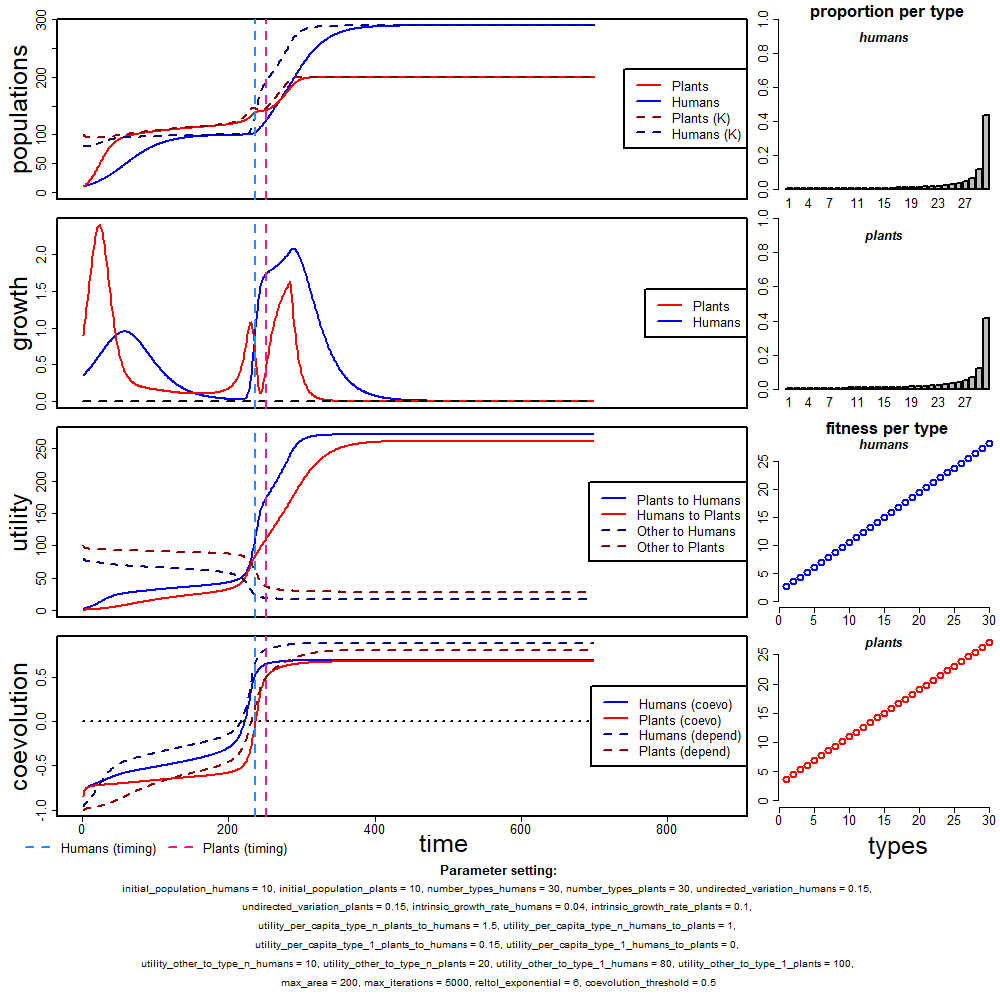
Figure 1.1: Plotting the end state, i.e. both populations become stationary
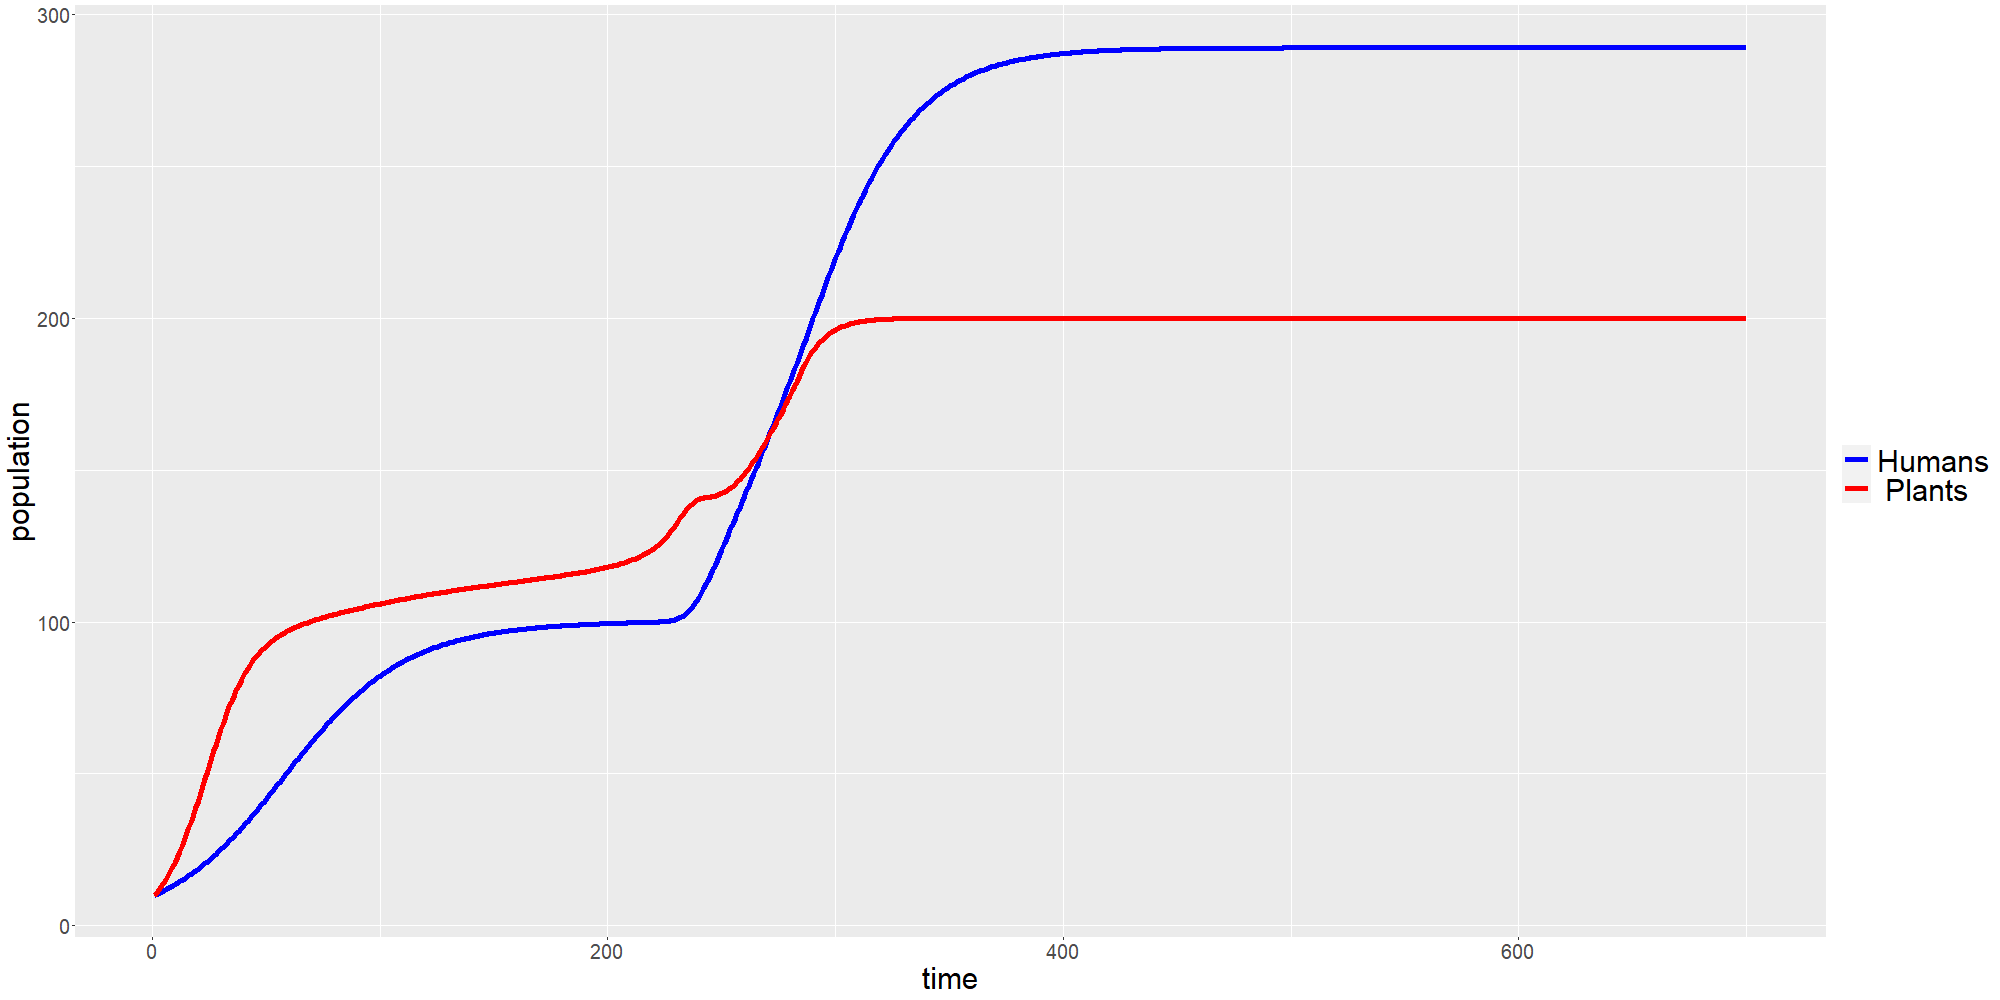
Figure 1.2: Plotting population trajectories with ggplot2
Figure 1.3: Animated GIF showing the sequence of states throughout the simulation (only on the html version)