3.3 Test the given chemical reference groups
Perform four tests (anosim, betadisper, permdisp2, and permanova) that assess the separation and uniformity of the given group factor. For more details on these tests, we refer to:
Anderson, M.J., Walsh, D.C.I., 2013. PERMANOVA, ANOSIM, and the Mantel test in the face of heterogeneous dispersions: What null hypothesis are you testing? Ecol. Monogr. 83, 557-574. doi:10.1890/12-2010.1
The whole test batch may take several minutes depending on the size of the data matrix and the number of groups.
prot1_tests <- test_groups(prot1$dist_matrix, factor_list$ChemGroup)
#> [1] "initiating test batch..."
#> [1] "vegan::anosim done."
#> [1] "vegan::betadisper done."
#> [1] "vegan::permutest done."
#> [1] "vegan::adonis done."
#> [1] "Test batch completed."
The tests outputs can be accessed by their name:
names(prot1_tests)
#> [1] "permanova" "betadisp"  "permdisp2" "anosim"    "text"
The object also contains a “text” object, which is a function that generates a list of text lines for plotting the results of PERMANOVA and PERMDISP2 tests. It may feel confusing, but keep in mind that this “portable” function requires the same ordination object as an argument.
displayTestText <- function(test_text) {
  par(mar = c(0, 0, 0, 0), fig = c(0.05, 0.9, 0.05, 0.9))
  plot.new()
  for (i in 1:length(test_text)) {

    # this is for calculating the vertical
    # position of paragraphs and lines
    test_spacing_paragraph = 0.8
    test_spacing_line = 0.8

    first_line_pos_y <-
      1 - test_spacing_paragraph * ( (i - .9) / length(test_text) )

    pos_y <- first_line_pos_y

    if (length(test_text[[i]]) > 1) {

      next_paragraph_pos_y <-
        1 - test_spacing_paragraph * ( i / length(test_text) )

      for (j in 2:length((test_text[[i]])))
      {
        pos_y <-
          c(pos_y,
            first_line_pos_y - test_spacing_line *
              ((j - 1) / (length((test_text[[i]])))) *
              (first_line_pos_y - next_paragraph_pos_y)
          )
      }
    }
    # display a paragraph (a element of the list)
    text(0, pos_y, labels = test_text[[i]], cex = 0.8, pos = 4)
  }
}

displayTestText(prot1_tests$text(prot1_tests))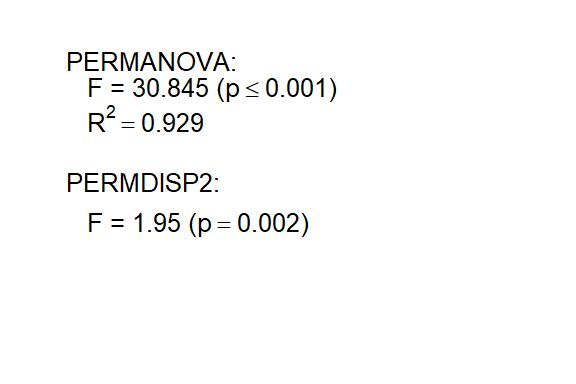
A rule-of-thumb for interpreting PERMANOVA and PERMDISP2 results is: if both p-values are low enough (e.g. < 0.05), the classification given is a good approximation of the data.