4.3 Biplots
The details on how to create biplots is already explained in protocol 1. Concerning protocol 2, we can compare the results of version 2a (RRD, PCoA) and 2b (NI, NMDS).
4.3.1 Biplot 2D
arrows_label_adj <- rbind(c(.5,.8),c(.5,1),c(.5,1),c(.5,0),c(.5,1),
                          c(.5,0),c(0,.5))
row.names(arrows_label_adj) <- c("L48","L24","L5","L36","S7",
                                 "S8","S11")

biplot2d3d::biplot_2d(prot2a_2d,
                      ordination_method = "PCoA",
                      invert_coordinates = c (TRUE,TRUE),
                      xlim = c(-.26,.35),
                      ylim = c(-.31,.35),
                      point_type = "point",
                      groups = factor_list$FabricGroup,
                      group_color = color_list$FabricGroup,
                      group_label_cex = 0.6,
                      arrow_mim_dist = 0.5,
                      arrow_label_cex = 0.6,
                      arrow_fig = c(.6,.95,0,.35),
                      arrow_label_adj_override = arrows_label_adj,
                      subtitle = prot2a_2d$sub2D,
                      test_text = prot2a_tests$text(prot2a_tests),
                      test_cex = 0.8,
                      test_fig = c(0, 0.5, 0.62, .99),
                      fitAnalysis_fig = c(0,.7,.05,.5),
                      output_type = "preview")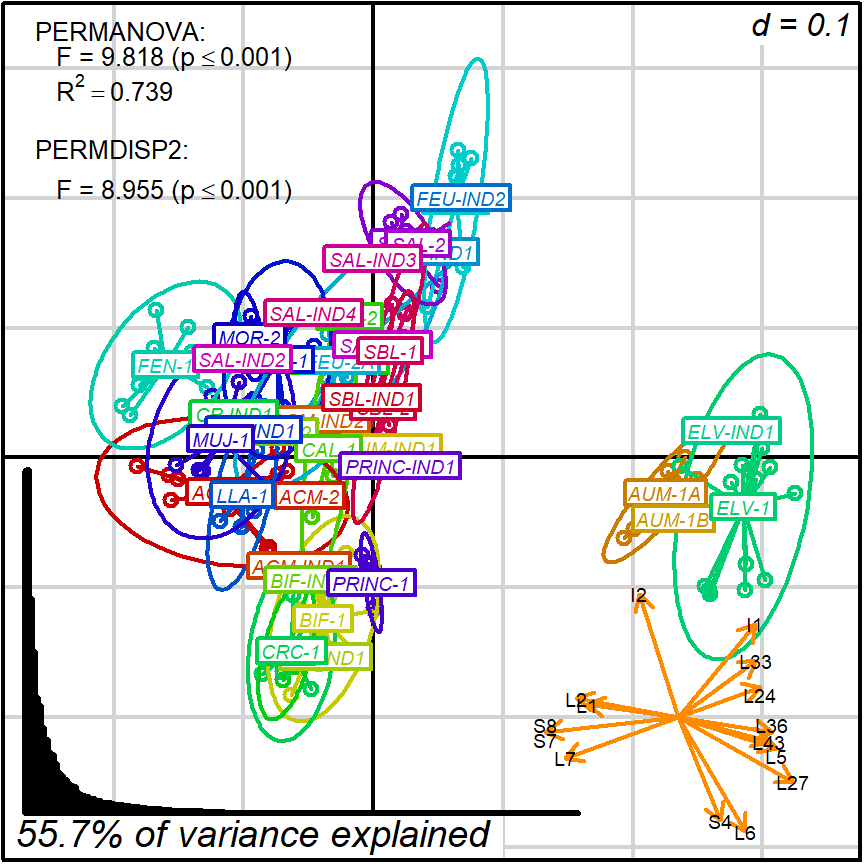
Figure 4.1: protocol 2a
arrows_label_adj <- rbind(c(.5,1),c(.5,0),c(.5,1),c(.5,1),c(.5,0),
                          c(0,.5),c(1,.5))
row.names(arrows_label_adj) <- c("S7","S8","CLAY","L24","L43",
                                 "L5","L36")

biplot2d3d::biplot_2d(prot2b_2d,
                      ordination_method = "NMDS",
                      xlim = c(-.42,.38),
                      ylim = c(-.45,.25),
                      point_type = "point",
                      groups = factor_list$FabricGroup,
                      group_color = color_list$FabricGroup,
                      group_label_cex = 0.6,
                      arrow_mim_dist = .5,
                      arrow_label_cex = 0.6,
                      arrow_fig = c(.6,.95,0,.35),
                      arrow_label_adj_override = arrows_label_adj,
                      subtitle = prot2b_2d$sub2D,
                      test_text = prot2b_tests$text(prot2b_tests),
                      test_cex = 0.8,
                      test_fig = c(0, 0.5, 0.62, .99),
                      fitAnalysis_stress_axis_cex = 0.8,
                      fitAnalysis_fig = c(.1,.6,.1,.4),
                      output_type = "preview")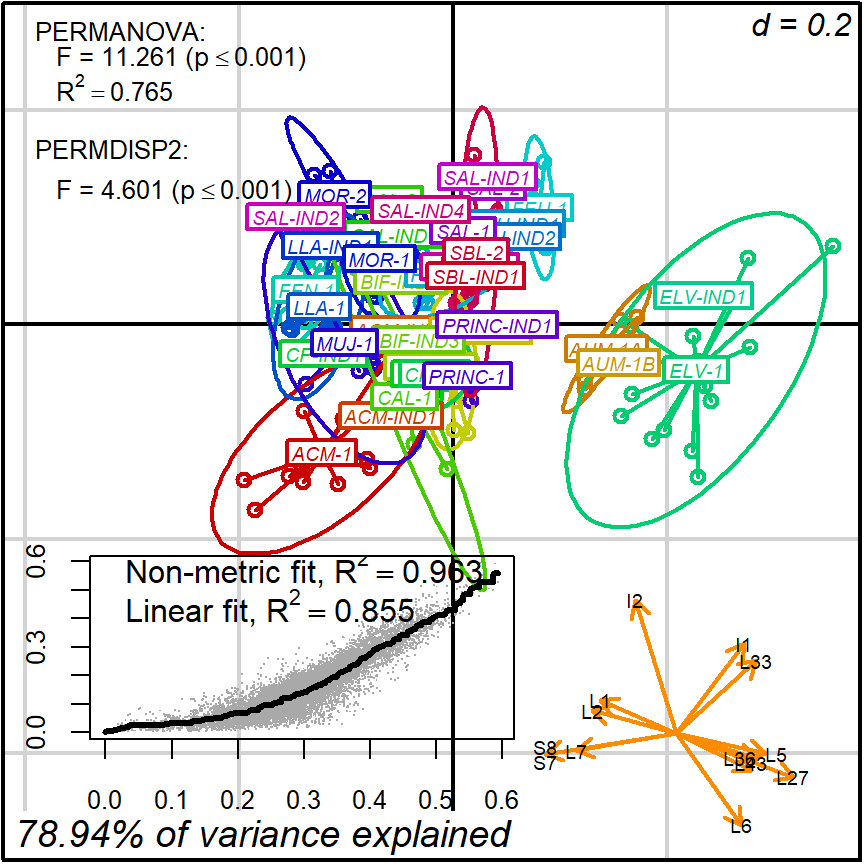
Figure 4.2: protocol 2b
4.3.2 Biplot 3D
biplot2d3d::biplot_3d(prot2a_3d,
                      ordination_method = "PCoA",
                      point_type = "point",
                      groups = factor_list$FabricGroup,
                      group_color = color_list$FabricGroup,
                      group_representation = "stars",
                      star_centroid_radius = 0,
                      star_label_cex = .8,
                      arrow_min_dist = .5,
                      arrow_body_length = .025,
                      subtitle = prot2a_3d$sub3D,
                      test_text = prot2a_tests$text(prot2a_tests),
                      test_cex = 1.25,
                      test_fig = c(0, 0.5, 0.65, .99),
                      view_zoom = 0.9)

biplot2d3d::animation(directory = directories$prot2,
                      file_name = "Prot2a_Biplot3D")
Figure 4.3: Prot2_Biplot3D.gif
NOTE: Animated GIF will not be displayed in the pdf version of this document.
biplot2d3d::biplot_3d(prot2b_3d,
                      ordination_method = "NMDS",
                      point_type = "point",
                      groups = factor_list$FabricGroup,
                      group_color = color_list$FabricGroup,
                      group_representation = "stars",
                      star_centroid_radius = 0,
                      star_label_cex = .8,
                      arrow_min_dist = .5,
                      arrow_body_length = .025,
                      subtitle = prot2b_3d$sub3D,
                      test_text = prot2b_tests$text(prot2b_tests),
                      test_cex = 1.25,
                      test_fig = c(0, 0.5, 0.65, .99),
                      view_zoom = 0.9)

biplot2d3d::animation(directory = directories$prot2,
                      file_name = "Prot2b_Biplot3D")
Figure 4.4: E2_Prot2b_Biplot3D.gif
NOTE: Animated GIF will not be displayed in the pdf version of this document.